Work

Projects and experiments

11 projects across language models, developer tools, analytics and teaching. The 6 with case studies are the ones I’d most like you to see.

Showing all 11 projects

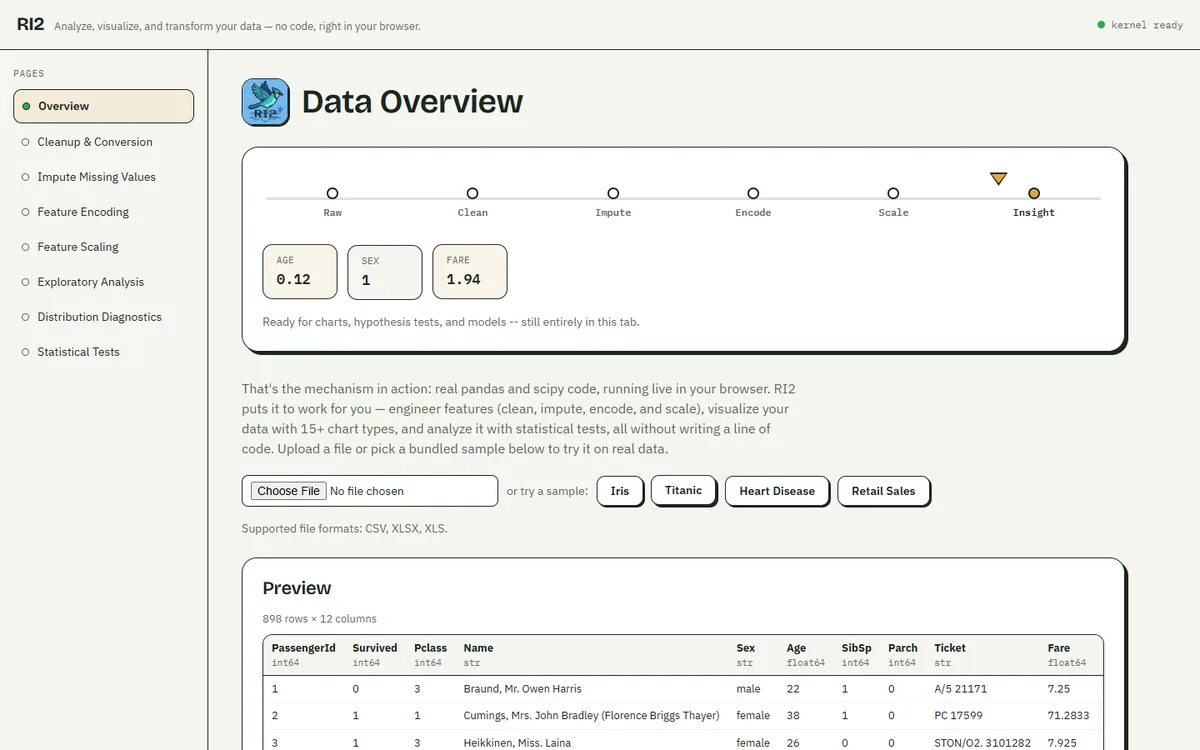
RI2’s Data Overview page with the Titanic sample loaded: a pipeline from Raw to Insight above a preview table of 898 rows and 12 columns.

Data tool · Web app

RI2 — Rapid Insights Data Engine

A no-code workspace for cleaning, visualizing and statistically testing tabular data, with real pandas and scikit-learn running in the browser through WebAssembly.
  • React
  • TypeScript
  • Pyodide
  • WebAssembly

Data tool · CLI

WRANG

Terminal-native data wrangling on Polars: inspect, clean, transform, query with SQL and export datasets from an interactive menu, a scriptable CLI or a Python API.

  • Python
  • Polars
  • DuckDB
  • Rich
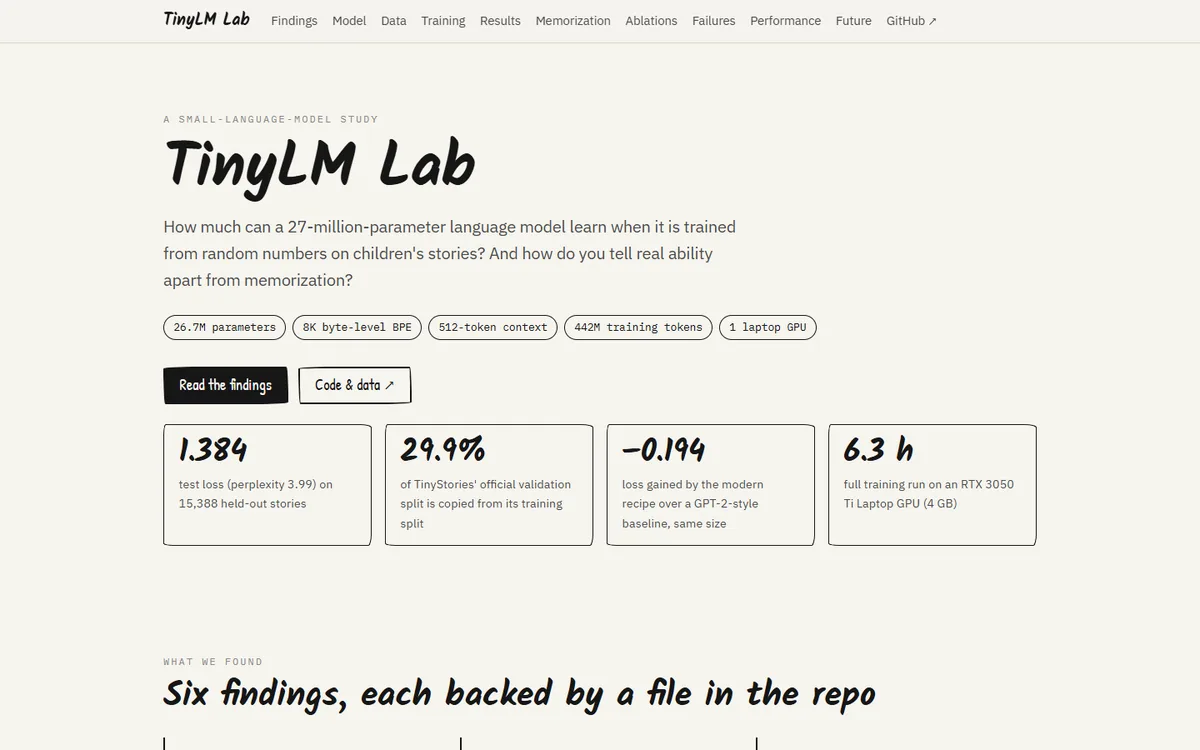
The TinyLM Lab project page: headline figures of 1.384 test loss, 29.9% of the official validation split copied from training, −0.194 loss gained by the modern recipe, and a 6.3-hour training run.

Language models · Research

TinyLM Lab

Pretraining a 26.7M-parameter Llama-style model from random initialization on one laptop GPU, then checking what it learned against memorization, leakage and controlled ablations.
  • PyTorch
  • Transformers
  • BPE tokenizer
  • TinyStories
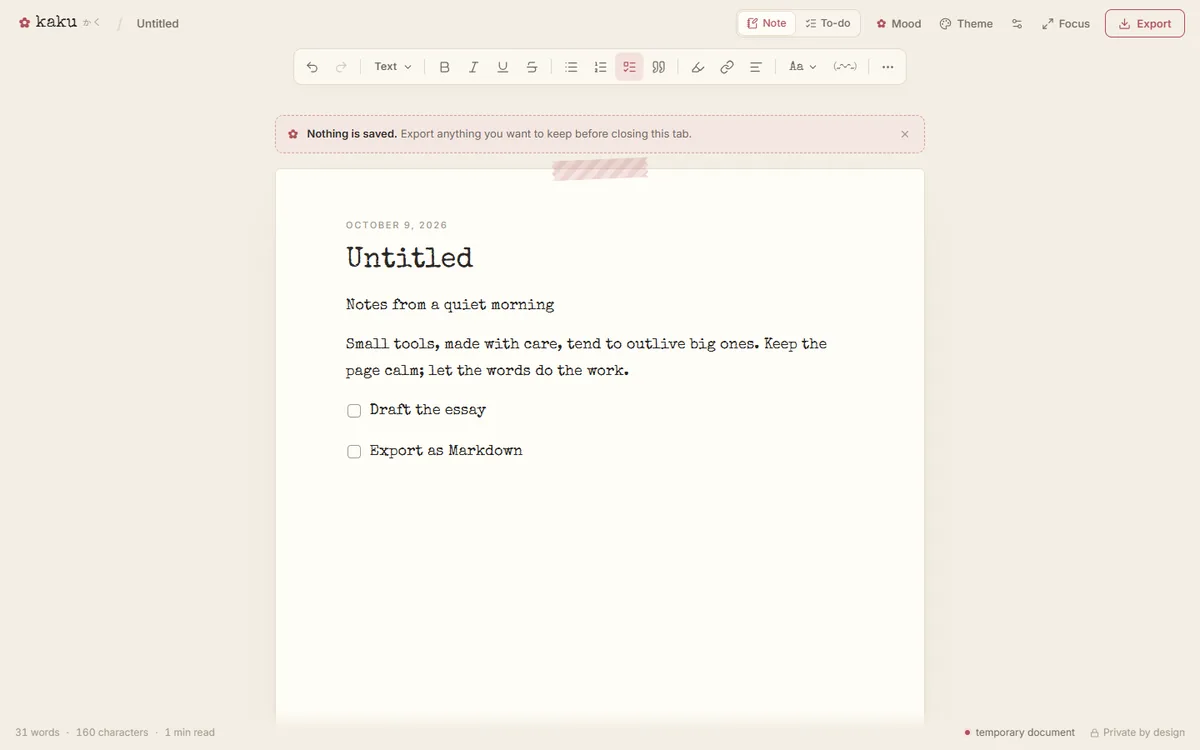
The Kaku editor: a quiet toolbar above a single sheet of paper holding a short note in a typewriter font and a two-item checklist, with a “Nothing is saved” notice above.

Web app · Product design

Kaku — Tiny Editor

A calm, private writing room in a browser tab: rich text, stationery-inspired themes and local export, with nothing ever saved or uploaded.
  • React 19
  • TypeScript
  • Tiptap
  • Playwright
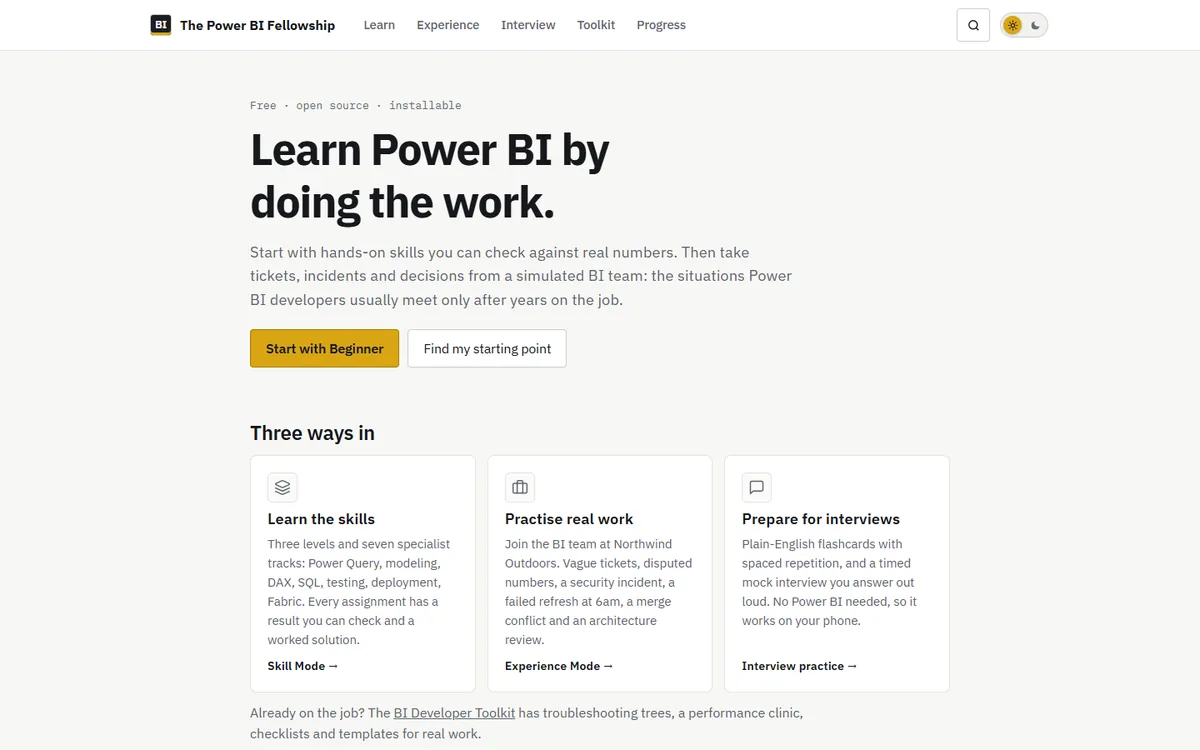
The Power BI Fellowship home page: “Learn Power BI by doing the work.” above three paths: learn the skills, practise real work and prepare for interviews.

Education · Analytics

The Power BI Fellowship

A free, open-source way to learn Power BI by doing the job: checkable skill exercises, then tickets, incidents and architecture decisions at a fictional company.

  • Power BI
  • DAX
  • SQL
  • Static site
retrieve guardrail generate evaluate score < 3 · retry ≤ 3 best answer FAISS · top-5 chunks

Generative AI · Document intelligence

Self-Correcting Multi-Document RAG

Question answering and summarization over multiple documents, with agents that filter irrelevant context, score each answer’s factual consistency and regenerate weak answers.

  • LangChain
  • OpenAI
  • FAISS
  • Gradio

Computer vision · Benchmark

Deep Learning Architectures on CIFAR-100

Fourteen architectures, from logistic regression and LeNet to EfficientNet and Vision Transformers, compared on accuracy, training time and parameter efficiency.

  • PyTorch
  • Transfer learning
  • Mixed precision
  • Colab L4
Results

Test accuracy on CIFAR-100, as reported in the repository

  1. EfficientNet-B285.48%
  2. EfficientNet-B084.60%
  3. EfficientNet-Lite083.14%
  4. ResNet-5082.90%
  5. RegNet-Y-400MF81.95%
  6. MobileNet-V3-Small79.35%
  7. ResNet-1878.56%
  8. DeiT-Small64.21%
  9. ViT-Base-1654.79%
  10. SimpleCNN38.95%
  11. AlexNet33.81%
  12. LeNet30.16%
  13. Logistic regression11.90%
  14. Swin-Tiny3.03%

Images were resized to 224×224, and the strongest models start from ImageNet-pretrained weights, so the top results measure transfer learning rather than training from scratch. Swin-Tiny’s 3.03% most likely reflects a failed run; the repository marks itself as experimental.

Multimodal AI · Research

Multimodal Medical Visual Question Answering

Fine-tuning LLaVA-1.5-7B with LoRA to answer questions about radiology images, evaluated with a custom token-level F1 pipeline.

  • LLaVA-1.5-7B
  • LoRA
  • PEFT
  • Hugging Face

Forecasting · Kaggle

GoDaddy Microbusiness Density Forecasting

Forecasting monthly microbusiness density for U.S. counties in a Kaggle competition, finishing in the top 24% of teams.

  • Time series
  • Extra Trees
  • XGBoost
  • LightGBM
Details
Objective
Forecast microbusinesses per 100 adults, by county and month, from GoDaddy’s Venture Forward data.
Features
County history plus Census ACS indicators: broadband access, college education, foreign-born population, IT workforce and median income.
Approach
Tree-based regressors compared on the same features; the write-up covers why Extra Trees stood out.
Metric
SMAPE, the competition’s official metric.
Outcome
Top 24% of teams on the leaderboard.

Sports analytics · Deep learning

Soccer Analytics: La Liga

A PyTorch classifier that predicts La Liga match results (win, draw or loss) from FBref match statistics, with a Streamlit dashboard for exploring team performance.
  • PyTorch
  • Streamlit
  • Plotly
  • pandas
Details
Data
La Liga match statistics from FBref: 2015–2021 seasons for training, 2022–23 for testing.
Features
Goals, expected goals (xG and xGA), possession, shots, and shot- and goal-creating actions.
Model
A multi-class neural network in PyTorch on min–max normalized features, predicting win, draw or loss.
Dashboard
A Streamlit and Plotly dashboard for team performance. The hosted copy currently asks for a sign-in, so it isn’t linked here.
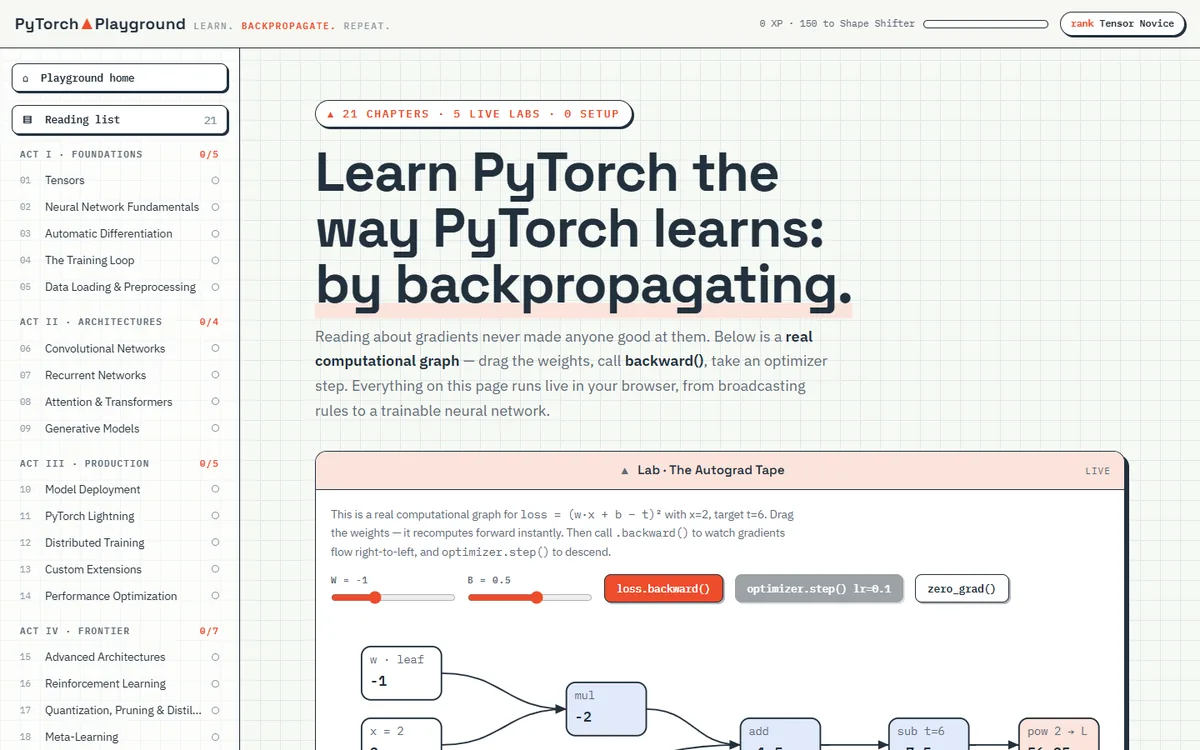
PyTorch Playground: a chapter sidebar in four acts beside the headline “Learn PyTorch the way PyTorch learns: by backpropagating.” and a live Autograd Tape lab showing a computational graph.

Learning lab · Education

PyTorch Playground

An interactive PyTorch curriculum in a single HTML file: 21 chapters, checkpoint quizzes and five live labs that run real forward passes and backpropagation in the browser.

  • PyTorch
  • Vanilla JS
  • Single file

Archive

Earlier work

Projects that have been superseded or were smaller in scope, kept here for the record.

  • RIDE-CLI

    The first command-line data analysis tool from my master’s project, now succeeded by WRANG.

  • RIDE (Streamlit)

    The original no-code platform from my thesis, with AutoML and LLM chat pages. It is preserved in RI2’s Archive folder.

  • American Express default prediction

    Gradient-boosted and linear models for credit default prediction on the AmEx Kaggle dataset, built for an advanced data mining course.

  • High-performance sorting visualizer

    Parallel sorting algorithms and scaling tests, built for a High Performance Scientific Computing class.

Contact

Have something interesting in mind?

I’m always interested in thoughtful collaborations, interesting research problems, and opportunities to build useful things.