Data tool · Web app
RI2 — Rapid Insights Data Engine
RI2 turns a messy CSV or Excel file into a cleaned, feature-engineered, charted and statistically tested dataset without writing code, and without the data ever leaving the browser tab.
- Type
- Static web application
- Stack
- React 19 · TypeScript · Vite · Pyodide · Plotly
- Runs on
- GitHub Pages, no backend
- License
- Apache 2.0
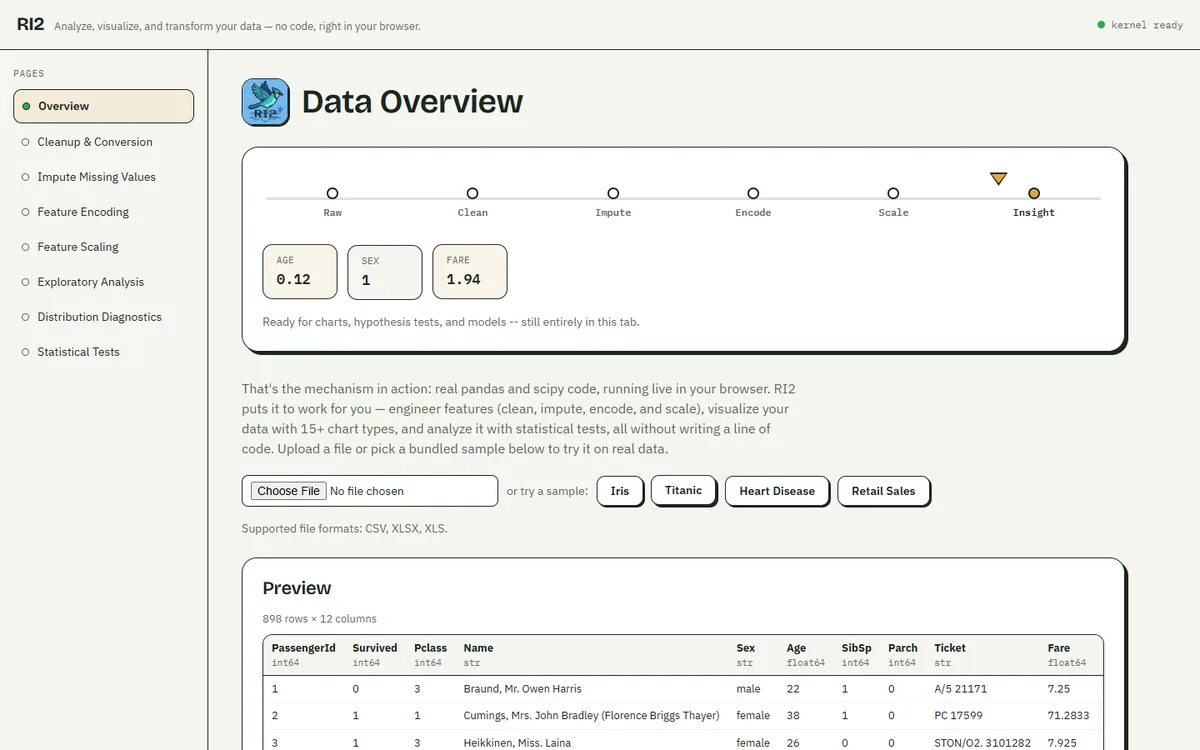
Overview
RI2 is a guided pipeline for tabular data (CSV, XLSX and XLS). You upload a file or pick a bundled sample (Iris, Titanic, Heart Disease or Retail Sales) and work through it stage by stage: overview, cleanup and type conversion, imputation, encoding, scaling, exploratory charts, distribution diagnostics and statistical tests.
It is written for people who need real statistical methods but don’t want to set up a Python environment: students, analysts and researchers who work with spreadsheets.
Motivation
RI2 is the second life of RIDE, the no-code platform I built for my master’s thesis, Rapid Insight Data Engine: Open-Source Framework for Agentic Automated Tabular Data Analysis. The original was a Streamlit app deployed on Kubernetes, with an AutoML page and two LLM chat pages.
Streamlit keeps a server process alive for every visitor, so a tool meant to be free had to run on paid, self-managed infrastructure. The chat pages also executed model-generated Python on the server, which was a real security risk. RI2 was rebuilt to remove the server entirely.
Architecture
- UIReact pages, one per pipeline stage
- Bridge
callPy(fn, args)RPC to a Web Worker - WorkerPyodide: CPython compiled to WebAssembly
- Pythonpandas · numpy · scipy · scikit-learn · plotly
- Python in a worker.
pyodide.worker.tsloads Pyodide and the scientific stack, then executes the project’s own Python modules into a shared namespace. Adispatch()registry exposes those functions to the UI. - One source of truth for the pipeline.
pagesConfig.tsdefines the stage order and drives the sidebar, the completion dots and the previous/next cards. - Dataset state. A React context tracks loaded and derived dataset previews and which stages are complete.
- Deployment. Every push to
mainbuilds with Vite and publishes static files to GitHub Pages through GitHub Actions.
Implementation and trade-offs
- Privacy by architecture. Every transform runs locally, so uploaded data is never sent anywhere. The trade-off is a slower first load while the Python runtime boots, which the app shows as a kernel status indicator.
- Features that didn’t survive the move. AutoML depended on xgboost, lightgbm and multiprocessing, which have no WebAssembly equivalent, so it was cut along with the chat pages rather than shipped half-working.
- AI explanations without a shared key. The optional “AI Insight” buttons call OpenAI with the visitor’s own key through a stateless Cloudflare Worker that only forwards CORS requests. Until it is configured, those buttons show a notice instead of an error, and the rest of the app works without it.
What it does today
- Feature engineering: type fixes, duplicate removal, 8 imputation strategies, categorical encoding and 8 scaling or transformation methods
- 15+ chart types across basic, advanced, specialized and geospatial categories
- Skewness and kurtosis, normality tests and IQR outlier detection
- 6 hypothesis tests: t-test, ANOVA, chi-square, Mann–Whitney, Wilcoxon and Kruskal–Wallis
Lessons and next steps
Moving computation into the browser removed the hosting cost and the security risk, but it moved the cost onto first load. The open work listed in the repository is code-splitting: Plotly currently lands in one large JavaScript chunk, and loading it lazily would speed up the first visit.