Language models · Research
TinyLM Lab
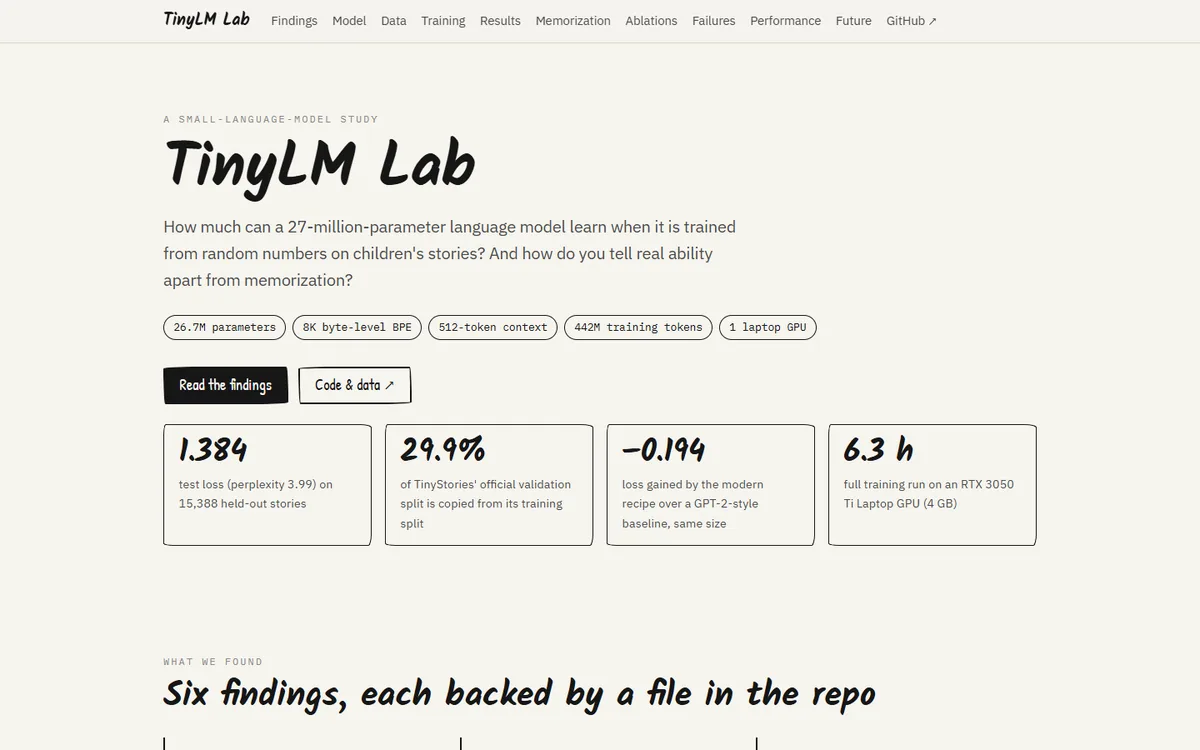
How much language-modelling ability can a modern 27M-parameter decoder learn from random initialization, and how do you tell real ability apart from memorization?
- Model
- 26,747,392 parameters, 8 layers, d = 512
- Data
- TinyStories, 442M training tokens
- Hardware
- One RTX 3050 Ti Laptop GPU, 6.26 h
- Result
- Test loss 1.3842 (perplexity 3.99)
Overview
TinyLM Lab is a complete, tested pretraining pipeline: data preparation with exact token accounting, a custom tokenizer, a training loop that resumes exactly, a three-way train/validation/test protocol, generation evaluation, memorization and leakage analysis, hardware benchmarks and controlled architecture ablations.
The tokenizer and every weight are trained from random initialization. The production model uses Hugging Face’s LlamaForCausalLM class. A framework-free implementation of every component is included for learning, and a test confirms it reproduces the Hugging Face model’s logits exactly.
Motivation
Running a training notebook is easy. Knowing what the trained model can and cannot do is harder. An earlier notebook run reported a validation loss of 1.4148, but about 30% of that validation split also appeared in the training data, the same split had selected the checkpoint, and the run had been resumed partway through in a way that showed up as a jump in the loss curve. This project rebuilt the experiment so that every reported number can be traced to a recorded output file.
Architecture
| Component | Choice |
|---|---|
| Decoder | 8 pre-norm blocks, d = 512, no biases |
| Attention | Grouped-query: 8 query / 2 KV heads, head dim 64 |
| Positions | RoPE, θ = 10,000 |
| Normalization | RMSNorm |
| Feed-forward | SwiGLU, 512 → 1,408 → 512 (64.7% of parameters) |
| Embeddings | Tied input/output, 8,192 × 512 |
| Tokenizer | 8,192-token byte-level BPE trained on the train split only |
| Context | 512 tokens, which holds about 95% of stories end to end |
Implementation
- A decontaminated test set. 6,582 of the 21,989 stories in TinyStories’ official validation split (29.9%) have an exact copy in the training split. Those stories are removed, and the rest becomes the test set, which is evaluated once, after model selection.
- A hand-written training loop instead of
transformers.Trainer: AdamW, a 6e-4 peak learning rate with warmup and cosine decay, bf16 autocast, and validation every 250 steps. - Exact resume. Checkpoints hold the model, optimizer, scheduler, RNG states and data position. A test checks that stopping and resuming gives bitwise-identical weights on CPU.
- Memorization checks. Every 8-, 16- and 32-token n-gram of each generation is checked against all ~460M training tokens. Held-out human-written stories serve as the baseline, not zero.
Results
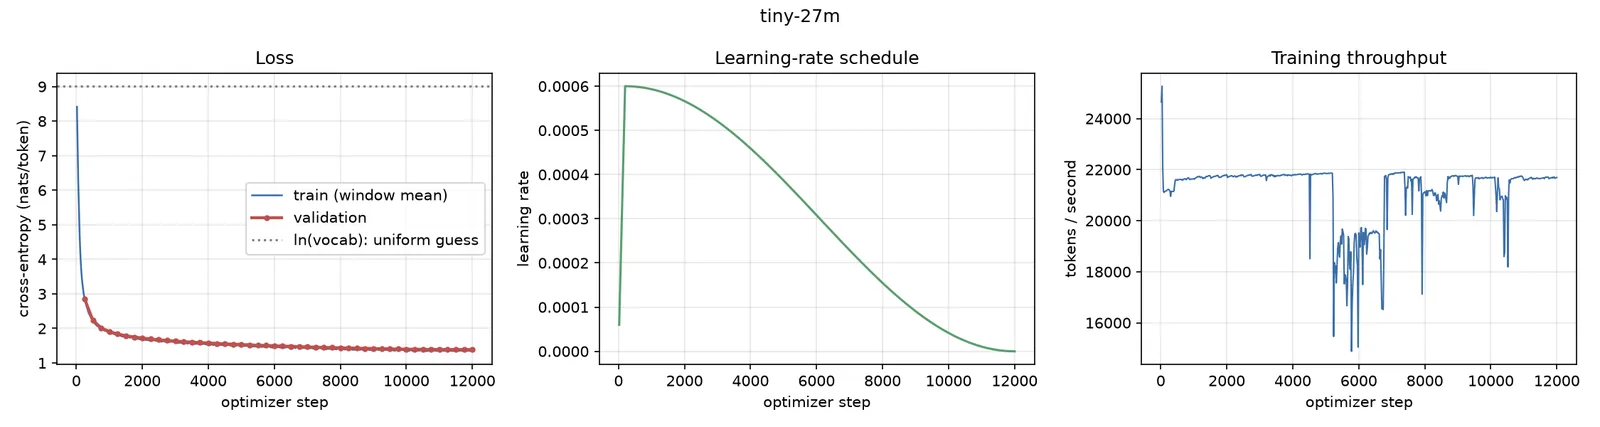
- Test loss 1.3842 (perplexity 3.99) on 15,388 held-out stories, 3.13M predicted tokens
- Validation loss improved at all 48 evaluations, with no sign of overfitting at 0.95 epochs
- Generations are no closer to their nearest training story than held-out human stories are (median TF-IDF similarity 0.255 vs. 0.250). 2.2% contain a verbatim 32-token span, against 7.5% of held-out stories.
- On a Core i5-11300H CPU, generation decodes at 89 tokens per second with a 25 ms time to first token
Ablations
Five parameter-matched variants, three seeds each, with the same implementation and data order:
| Variant | Val loss (mean ± sd) | Δ vs. previous |
|---|---|---|
| GPT-style baseline | 2.2208 ± 0.0019 | — |
| + RoPE | 2.0848 ± 0.0042 | −0.136 |
| + RMSNorm | 2.0887 ± 0.0028 | +0.004 |
| + SwiGLU | 2.0600 ± 0.0183 | −0.029 |
| + GQA (production) | 2.0268 ± 0.0143 | −0.033 |
RoPE was the single most important change, at about 50× the seed-to-seed spread. RMSNorm made no difference to quality at this scale. These are early-training comparisons, at about 5.6% of the main run’s token budget.
Lessons
Most of the work went into evaluation, not training. The number that first looked best came from a contaminated split. The measurements that held up came from deciding up front which split answers which question and recording where every figure came from.